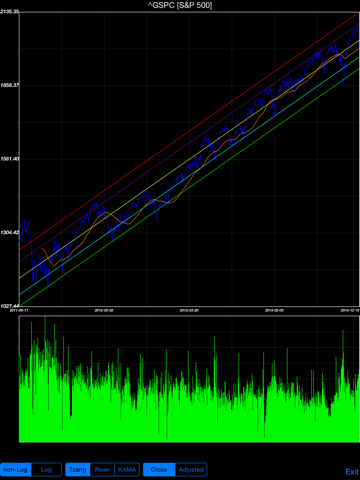
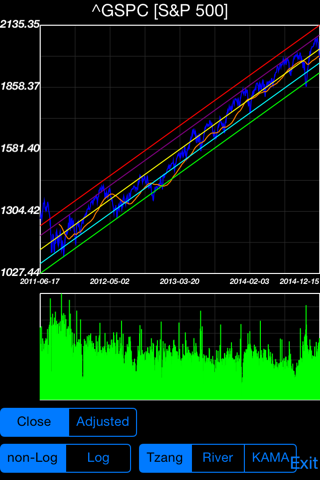
Finance Conduit is based on Tzang's Conduit. Tzang‘s Conduit was raised by Dr.YC Chan. You can read more about his theory in his website: http://www.ycchan.net/theory.aspx.
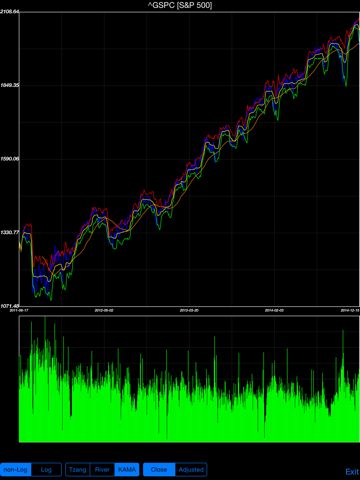
Kaufman Adaptive Moving Average was created by Perry J. Kaufman. You can find more information in http://fxcodebase.com/wiki/index.php/Kaufman's_Adaptive_Moving_Average_(KAMA) .
Selling Pressure Ratio(SPR) and K volatility(KV) was created by Hayashi Noriyuki. I can't find a English website describe it but it's very like the Money Flow Index (http://en.wikipedia.org/wiki/Money_flow_index).
Bollinger Bands is a technical analysis tool invented by John Bollinger in the 1980s as well as a term trademarked by him in 2011.[1] Having evolved from the concept of trading bands, Bollinger Bands and the related indicators %b and bandwidth can be used to measure the highness or lowness of the price relative to previous trades. You can read more information at http://en.wikipedia.org/wiki/Bollinger_Bands .
Acceleration Bands was found by Price Headley, you can find more information in his book(Big Trends in Trading) or his website(http://www.bigtrends.com/price-headley/). Here we use SPR Period as it's period for calculation.
Mansfield Relative Strength indicator is used to compare the stock price with the weighted index. If the value is positive, it's stronger than the weighted index, else it's weaker. Currently supporting comparing Taiwan Stocks(.tw/.two) with ^TWII and Mainland China's stock(.ss) with 000001.ss and Hong Kong(.hk) stocks with ^HSI and England stocks(.l) with ^FTSE and German stocks(.de) with ^GDAXI and France stocks(.pa) with ^FCHI and Korean stocks with ^KS11, all others compare with S&P500(^GSPC), if it shows ^GSPC+5, means it's stronger than S&P500 for 5 days. You can find it's algorithm here(http://stageanalysis.net/reference/how-to-create-the-mansfield-relative-strength-indicator/558).
Big Volume scan is used to detect if the average periods' volumes are greater than previous comparison periods' average multiply the multiplier and the last close price is greater than the SMA value. If detected, it'll show BV. Also if the last trade date's price is greater than SMA value, it'll show SMA+x, means greater for x days, or SMA-x for less for x days.
Other reference website:
1. http://allanlin998.blogspot.tw
2. https://www.facebook.com/groups/alpha168/
3. http://freenenjoy.blogspot.tw/2013/08/blog-post.html
Version 4.3.3:
1. Fix bug: Fund not working issue.
2. Remove volume window for fund when portrait.
Version 4.3.0:
1. Fix bug: Yahoo service might fail problem.
2. Fix bug: Google service fail issue.
Version 4.2.0:
1. Fix bug: at google service, the decimal part of the period will be skipped.
Version 4.1.0:
1. Yahoo is back. Now support yahoo finance new API.
Version 4.0.0:
1. Add Google Finance support. Note that the index field need to input index/exchange. You can visit (https://www.google.com/googlefinance/disclaimer/) for the supported exchange. Also noted that currently Google service do not support the setting of weekly/monthly, nor the end date setting. You always get from the last trading day.
Version 3.5.4:
1. Fix some problem that SPR calculation might crash in some case.
Version 3.5.1:
1. Add MRS weekly and monthly period in setup page which correspond to the daily/weekly/monthly setting in main page.
2. Modify the selection range in Graph page to check DAILY/WEEKLY/MONTHLY setting in main page.
Version 3.5:
1. Add swipe left/right to switch to next/previous stock/fund. Or single tap on the scrren to show next/previous button and press the button to switch.
2. Add show BBand and ABand position in Scan. BB+x means over BB top line for x days. BB=x means between top and bottom lines for x days. BB-x means below bottom line for x days.
3. Add new settings WEEK MA and MONTH MA.
Version 3.4.3:
1. Fix bug: Some app crash issue.
2. Adjust font size of some pages so that all text can be seen.